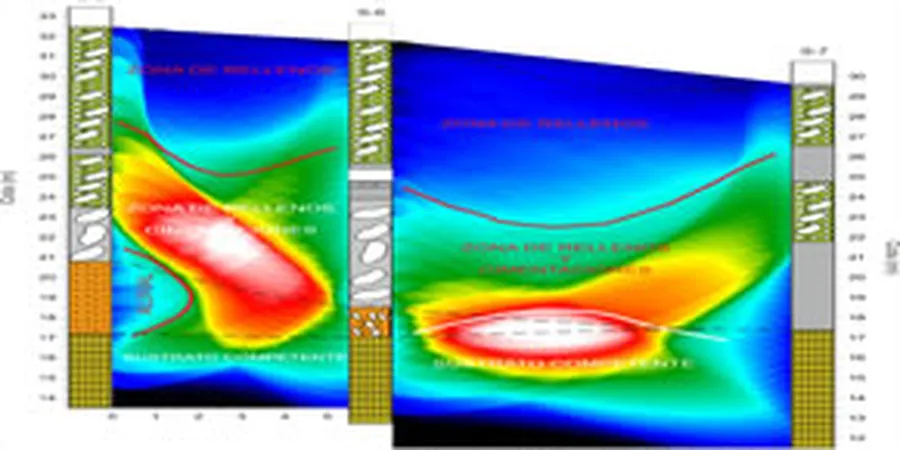
ASCE 7 requires site-specific seismic ground motion parameters for most projects in Albuquerque, given the city's location within the Rio Grande Rift zone. Seismic tomography (refraction and reflection methods) provides the detailed P-wave and S-wave velocity profiles needed to classify the site class under ASCE 7 Table 20.3-1. The method uses a linear array of geophones to record energy from a controlled source (sledgehammer or accelerated weight drop), producing a 2D velocity model of the subsurface down to 30–50 meters. Before proceeding with foundation design, we often recommend combining this survey with a MASW-Vs30 study to directly measure shear wave velocity for deeper layers, ensuring compliance with IBC 2018 seismic provisions in Albuquerque.
A single seismic tomography line can image velocity contrasts between Rio Grande alluvium and bedrock at depths where boreholes alone would miss lateral transitions.
Methodology and scope
Local considerations
The main risk in Albuquerque is misclassifying the site class due to insufficient depth of investigation. A shallow refraction survey may only reach 15–20 meters, leaving the deeper, softer basin fill undetected. If the survey underestimates the thickness of low-velocity material, the design spectrum can be non-conservative — a real concern for structures near the Rio Grande valley where alluvium exceeds 30 meters. We mitigate this by extending the array length and using both refraction and reflection processing. For critical facilities, we also cross-check with borehole data and recommend a complementary response spectrum analysis to validate the site-specific ground motion parameters.
Applicable standards
ASCE 7-16 Chapter 20 (Site Classification for Seismic Design), ASTM D5777-18 (Standard Guide for Seismic Refraction), NEHRP Recommended Provisions (Site Classes A through F)
Associated technical services
Refraction Tomography (2D)
P-wave velocity profiling using first-arrival traveltime inversion. Ideal for bedrock depth mapping, rippability assessment, and site class determination under ASCE 7.
Reflection Imaging (2D)
High-resolution imaging of stratigraphic boundaries and fault zones using reflected P-waves. Recommended for deep foundations, tunnel alignment studies, and fault hazard assessment.
MASW-Vs30 Integration
Combined seismic tomography and multichannel analysis of surface waves to measure shear wave velocity (Vs30) directly, meeting NEHRP requirements for site class C, D, and E.
Downhole Seismic (PS Logging)
Borehole-based P-wave and S-wave velocity measurement for calibration of surface tomography results. Used when absolute velocity values are critical for dynamic analysis.
Typical parameters
Frequently asked questions
How deep can seismic tomography image in Albuquerque soils?
With a 240 m array and an accelerated weight drop source, we typically achieve 40–50 m depth in the Santa Fe Group deposits. Deeper targets (50–70 m) require larger sources or downhole logging.
What is the difference between refraction and reflection tomography?
Refraction uses first-arrival traveltimes to build a velocity model, best for mapping layer boundaries. Reflection uses reflected wave amplitudes to image internal structure such as fault zones or channel fills. We often apply both methods on the same dataset.
Can seismic tomography replace boreholes for site classification?
No — it complements them. Tomography provides continuous 2D velocity profiles between boreholes, but borehole logs are still needed for soil classification (ASTM D2487) and laboratory testing. We recommend a combined approach.
How much does a seismic tomography survey cost in Albuquerque?
Typical project costs range between US$2,900 and US$5,300 depending on array length, number of profiles, and terrain difficulty. This includes field work, processing, and a report with interpreted cross-sections.
What is the turnaround time for a tomography survey?
Field work takes 1–2 days for a standard profile. Data processing and reporting require an additional 3–5 business days. Expedited service is available for time-sensitive projects.