IBC Chapter 16 and ASCE 7-22 require a site-specific shear wave velocity profile for seismic design categories C through F. In Albuquerque, the Rio Grande rift geology makes that requirement more than a code checkbox. The valley floor holds unconsolidated alluvial deposits that can amplify ground motion, while the adjacent Sandia foothills sit on fractured granite with completely different dynamic behavior. A seismic tomography survey maps those contrasts before the structural engineer places a single column. We run both refraction and reflection arrays, acquiring P-wave and S-wave data that feeds directly into site class determination and foundation analysis. For projects on the west mesa or near the Rio Puerco fault zone, the velocity cross-sections also help screen for buried paleochannels that borehole-only investigations can miss between drilling points.
A single seismic tomography line across the site gives you more stratigraphic control than ten widely spaced borings, especially in the heterogeneous basin fill of the middle Rio Grande valley.
Process and scope
Area-specific notes
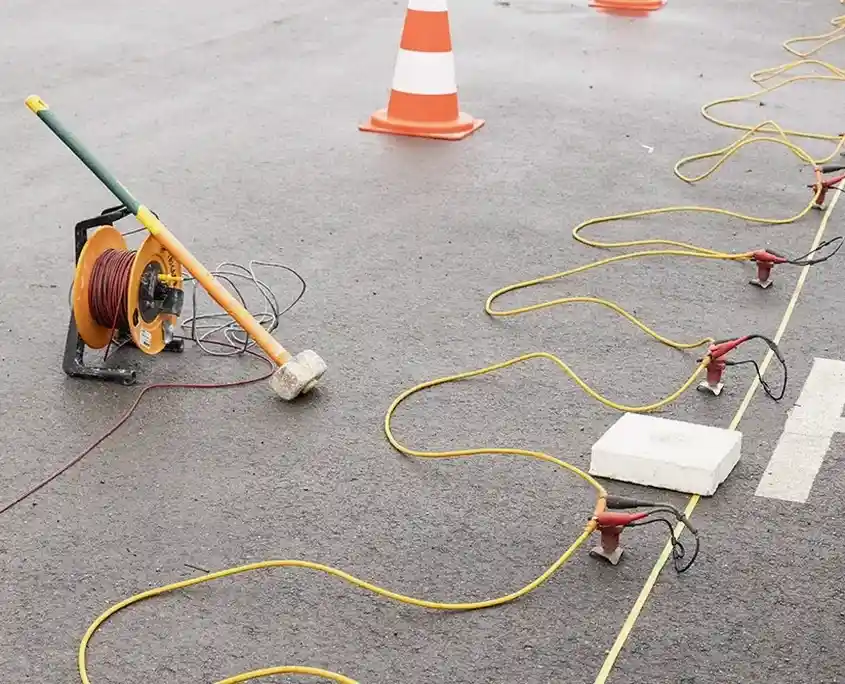
The accelerated weight drop we mobilize in Albuquerque is a trailer-mounted system that delivers a repeatable, broadband impulse without the permitting and safety overhead of explosives. In the urban grid east of I-25, the same source lets us shoot lines along street medians and parking lots without shutting down traffic. The risk we manage on every survey is poor coupling in dry sand, which is common on the west mesa where surface moisture drops below two percent in June. We pack geophones with wet bentonite or use base-plate spikes, and we run reciprocal shots to verify travel-time symmetry. If a cable is nicked by construction traffic or a geophone channel drifts, the acquisition software flags it in real time. The velocity model does not leave the field until every shot gather passes a signal-to-noise threshold, because a single bad trace can pull the tomographic inversion off by several meters at depth.
Relevant standards
ASTM D5777-18 Standard Guide for Using the Seismic Refraction Method, ASTM D7400-19 Standard Test Methods for Downhole Seismic Testing, ASCE 7-22 Minimum Design Loads, Chapter 20 Site Classification Procedure
Linked services
Vs30 Site Classification
Combined refraction and downhole S-wave acquisition to compute the travel-time averaged shear wave velocity in the upper 30 meters. Delivered with the ASCE 7-22 site class letter and the velocity profile plot ready for the structural peer review package.
Bedrock Depth Mapping
Refraction tomography lines oriented to capture the granite-alluvium interface along the Sandia foothills. Used to plan excavation depths, estimate rippability, and position drilled shaft sockets into competent rock.
Fault and Paleochannel Screening
High-resolution reflection profiles across suspected fault traces or buried river channels. Velocity anomalies correlated with available borehole logs to reduce uncertainty in foundation bearing strata continuity.
Rippability and Excavation Assessment
P-wave velocity cross-sections interpreted against Caterpillar rippability charts. Provides the contractor with a linear meter-by-meter forecast of hard digging versus machine-rippable material for utility trench and basement excavation bids.
Typical parameters
Common questions
How does seismic tomography differ from a standard MASW survey?
MASW uses surface-wave dispersion to build a 1D Vs profile beneath the array midpoint, which works well for layered sites. Seismic tomography solves a 2D velocity model from first-arrival travel times, so it images lateral changes like a dipping bedrock surface or a buried channel edge. In Albuquerque basin fill, where stratigraphy can shift within a building footprint, the 2D result often prevents surprises during excavation.
What is the typical cost for a seismic tomography survey in Albuquerque?
A single seismic tomography line with P-wave and S-wave acquisition generally runs between US$2,900 and US$5,300, depending on the array length, number of shot points, and whether downhole S-wave measurements are included. Projects with multiple intersecting lines or difficult access on the west mesa slopes can push toward the upper end of that range.
Can you shoot seismic lines on paved surfaces?
Yes, and we do it regularly in Albuquerque. The accelerated weight drop sits on a rubber pad that does not damage asphalt or concrete. Geophones are planted in landscaping strips or drilled into pavement with a small anchor bolt. We have run full 115-meter spreads along medians on Montgomery Boulevard and in commercial parking lots without disruption.
How long does a typical survey take, and when do I get the report?
Field acquisition for one or two lines takes one day, assuming standard access and weather. Data processing, tomographic inversion, and report drafting require three to five business days. The report includes the velocity cross-section, a Vs30 calculation table, and a brief interpretation of the geotechnical implications tied to the project structural loads.
What depth of investigation can I expect in Albuquerque soils?
With a standard 115-meter spread and the accelerated weight drop, we typically image 25 to 35 meters in the compacted alluvium of the valley floor. On the granite foothills, where velocities are higher, the same array may reach 40 meters. If the project requires deeper penetration, we extend the spread length or supplement with downhole seismic methods at a borehole location.